Everyone is talking about Treasuries, again. It has dawned on people that Europe is, in fact, the largest holder of U.S. Treasuries (readers of this post—originally published in April 2024—knew this, of course). There are murmurs that the response to the Trump administration’s trade war should be financial war. Forget about boots on the Arctic ground, let’s threaten a fire sale of US assets. Easy, write Robin Wigglesworth and Toby Nangle in an excellent FTAV piece—“colour Alphaville a crimson shade of sceptical that this is a credible threat.” I share their scepticism.
The bond market is not very transparent. Still, we can know quite a bit about the global distribution of Treasury holdings just from public data. I’ll start with a quick look at global official reserve holdings in general, then will move on to the holder structure of U.S. government debt in particular, and end with weekly data that shows what has happened to foreign official holdings of Treasuries at the Fed since “Liberation day”. The remainder of the post is unchanged from the original version, except for the charts, which have the latest data.
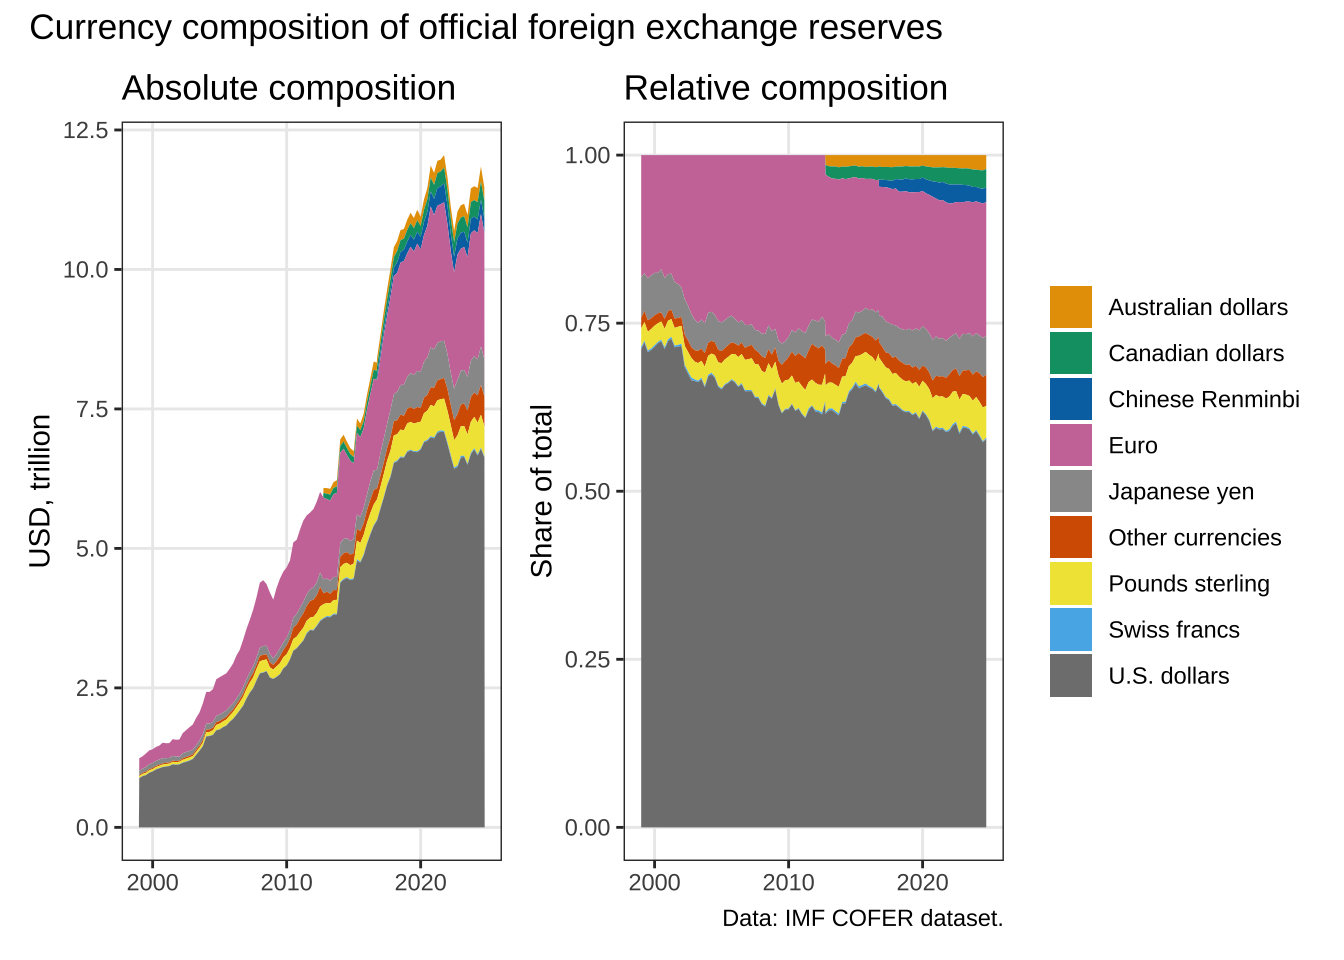
Currency composition of official reserves
Global official reserve holdings are tracked by the IMF’s Composition of Official Foreign Exchange Reserves dataset (COFER), which provides globally aggregated data. Panel A in Figure 1 shows global official FX reserves increased 10-fold between 1999 and 2020, from $1.25 trillion to $12 trillion. That is the famous official foreign reserve glut, fueled by the aftershock of the Asian financial crisis and by the massive trade surpluses of, first and foremost, China and Japan. Panel A also shows that the total volume of U.S. dollar reserves has seen a moderate decline in recent years.
Regarding the composition of those global reserve holdings, the picture is one of incremental change. As shown in panel B, the share of U.S. dollar share has fallen, but only modestly, from 71% in 1999 to 58% today. What is more, the 1999 value marked an all-time high—in 1995 (not visible here), the U.S. dollar share was 59%.
The emergence of the Australian and Canadian dollars, and of the Chinese Renminbi, indicates a clear trend towards diversification of official reserve portfolios. However, this is aggregate data—it may obscure shifts that become visible only at a more granular level.
The global holder structure of U.S. Treasuries
If we want to know more about individual countries’ holdings of U.S. securities, we need Treasury International Capital (TIC) data. The historical file is updated annually and is available here. The latest version was released in April 2025). TIC data is an invaluable resource—no other single file contains more information about the finance-geopolitics nexus. (Unfortunately, it is also an untidy mess.)
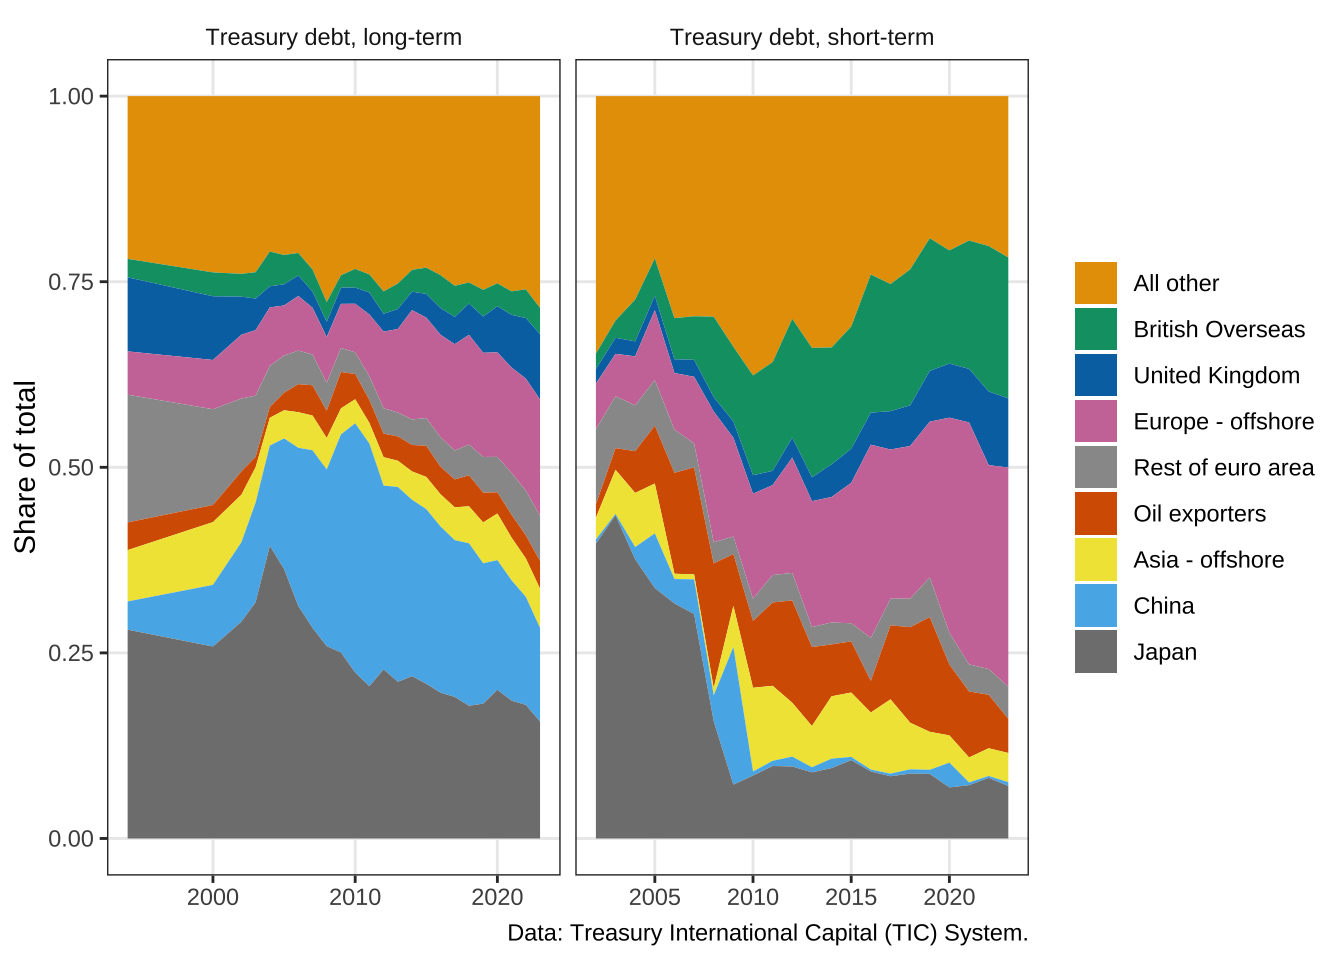
In Figure 2, I have aggregated countries into groups that I think make the most sense. Besides China and Japan, I am putting the emphasis on offshore financial jurisdictions (Anglo: UK & British Overseas; Europe: Benelux, Ireland, Switzerland; Asia: Hong Kong-Singapore), as well as on the oil-exporting countries. These groups together hold three quarters of foreign-held Treasuries.
The TIC data makes a distinction between Treasuries with long (maturity of one year or more) and short remaining maturities. Short-dated Treasuries account for only $1 trillion, vs $6 trillion of long-term debt, meaning we need to focus on the first panel. The big story is familiar by now: The share of the two largest foreign creditors of the U.S. government, China and Japan, peaked just after the global financial crisis at just above 50% of all foreign-held Treasuries. This share has since declined at a steady clip and is down to 25%.
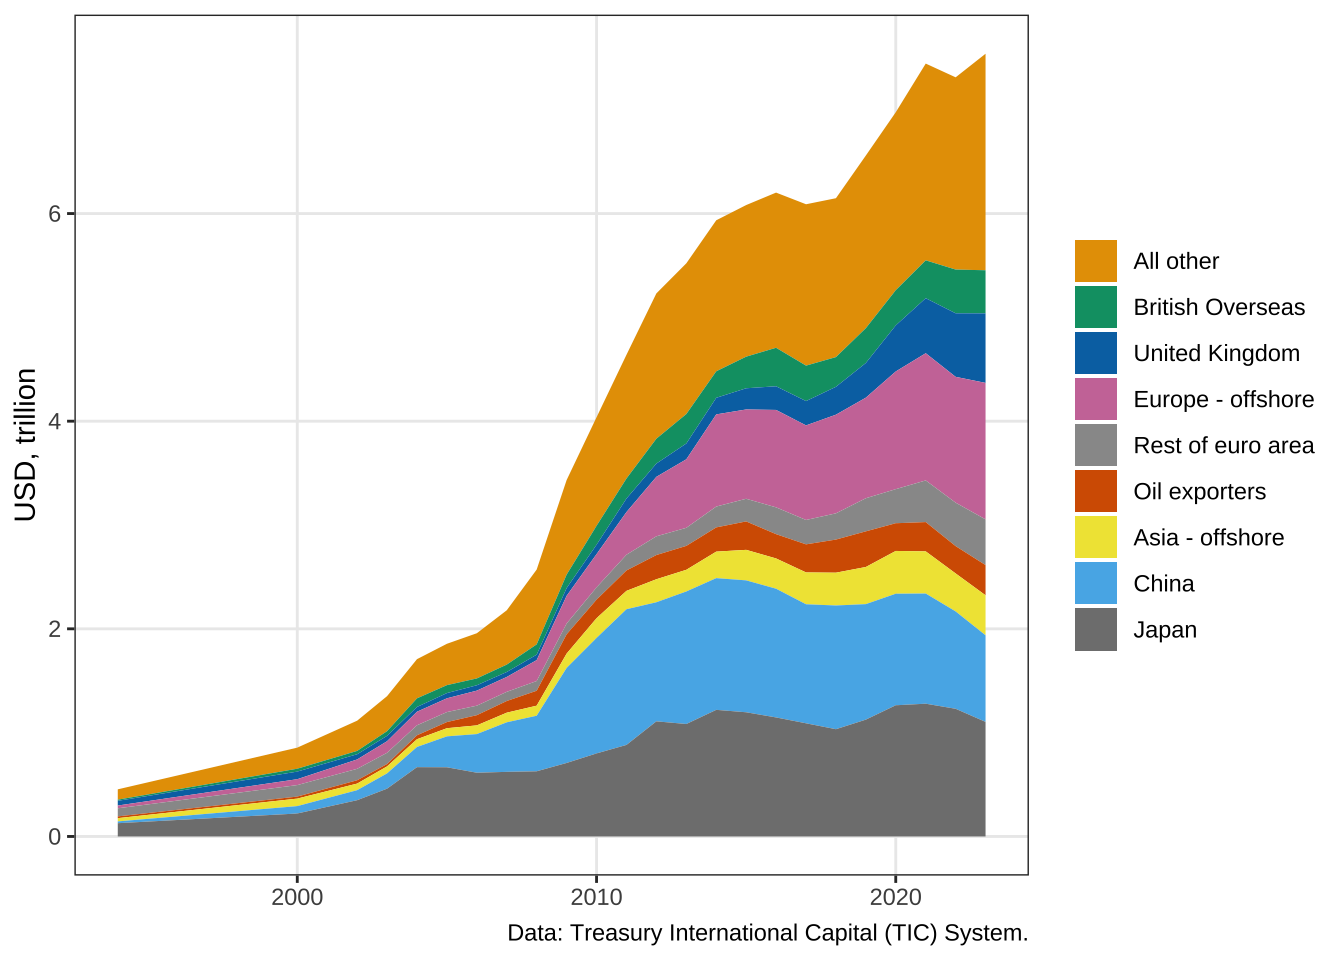
Does this mean China and Japan have sold off their holdings of U.S. treasuries? For this, we need to look at nominal amounts. Figure 3 shows foreign-held U.S. treasuries of all maturities, long and short. We can see that the total volume of foreign-held U.S. debt has skyrocketed since 1994, from $500 billion to over $8 trillion. Zooming in on the big-2, it appears that China has indeed shrunk its U.S. treasury portfolio quite significantly, from $1.3 trillion in 2011 to $780 billion today. It’s not quite that easy though: This decline in direct holdings is counteracted by a significant increase, after 2010, of indirect holdings via custodial accounts Belgium. Brad Setser has been documenting this for many years. Japan, meanwhile, has reduced its direct treasury holdings at a slower pace, they currently stand at $1.1 trillion). Regardless of the precise size of China’s custodial Belgian holdings, China and Japan have reversed or slowed their accumulation of Treasuries but remain the largest—by far—foreign creditor to the U.S. government.
There is, of course, an elephant in this room: Total outstanding U.S. government debt held by the public has massively increased in recent years and stands at $30.8 trillion today (intragovernmental holdings add another $7.7 trillion to the total, see here). Clearly, domestic holders must have absorbed this increased supply. Who are they?
The rise and fall of foreign treasury holdings
To better understand the domestic distribution and the domestic-international divide in the holder structure of U.S. Treasuries, we can turn to the Fed financial accounts.
Figure 4 immediately makes obvious what we miss when looking only a COFER and TIC data: The massive internationalization of U.S. treasury holdings between 1945 and 2008, from virtually zero in 1945 to just below half of the outstanding volume by 2008. Equally astonishingly, this trend has since reversed, and foreign holdings of Treasuries currently stand at about 30% of the total. In other words, although foreign holdings of U.S. Treasuries have continued to grow, the relative share of foreigners in the holder structure has been in decline ever since the global financial crisis. The slack has been picked up, of course, by the Fed.
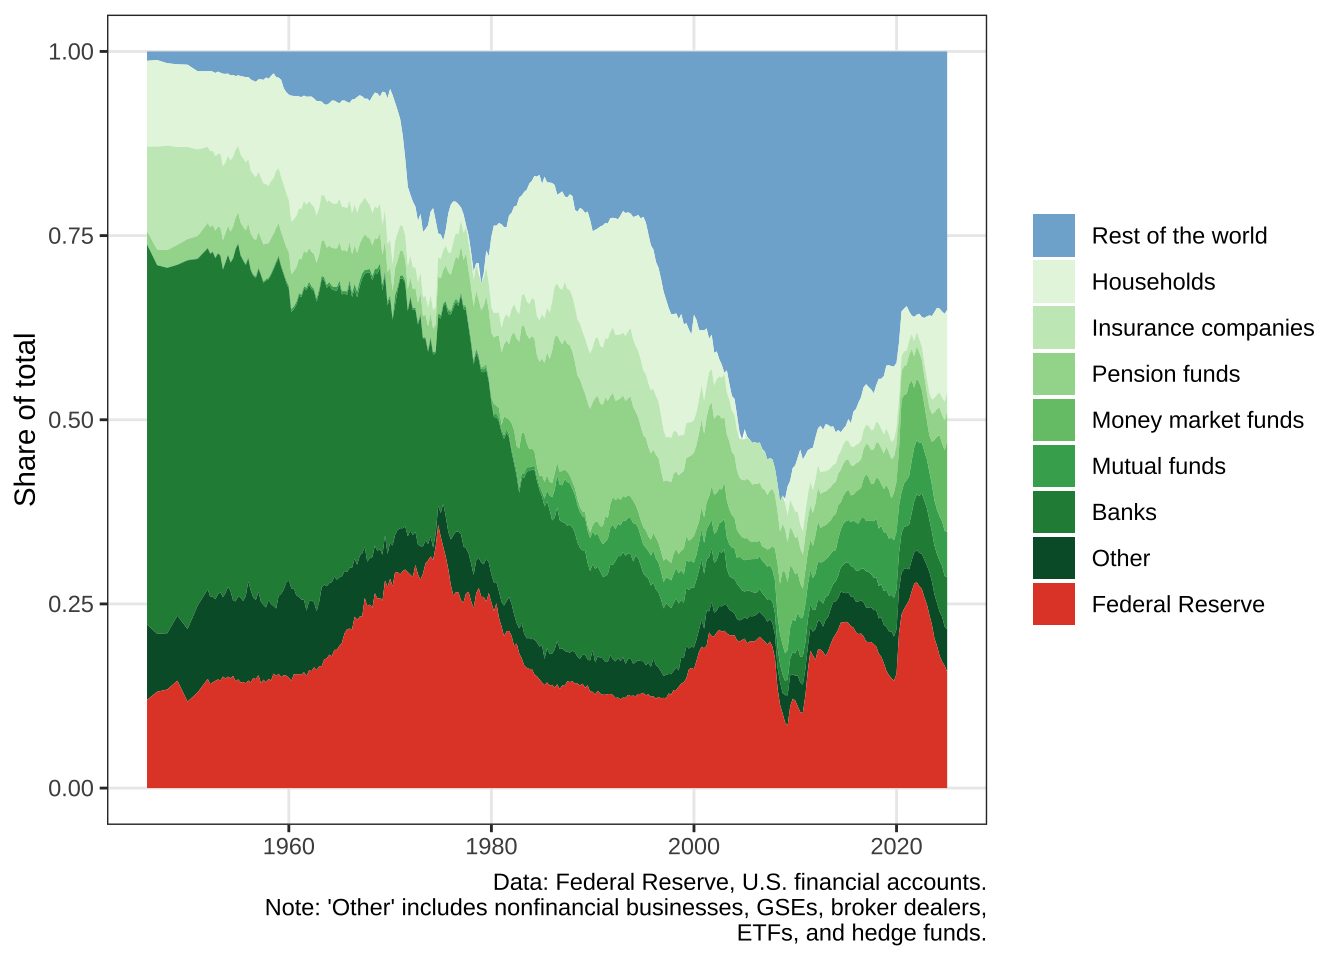
Most recently, the Fed, too, has dramatically reduced its holdings. This time, the slack has, seemingly, been picked up by individual investors. However, in financial accounts data, domestic hedge funds tend to be captured by the ‘households’ category. The growth of the ‘household’ holdings may therefore reflect the massive increase in treasury holdings by levered hedge funds betting on Treasuries in the “cash-futures basis trade” (Aldasoro and Doerr 2025).
Weekly data on foreign official holdings
For the latest developments, there is weekly data on securities held in custody for foreign official and international accounts directly at the Fed. The New York Fed “provides U.S. dollar-denominated banking services to foreign official and international institutions in support of Federal Reserve objectives and in recognition of the dollar’s predominant role as an international currency.” This data is displayed in Figure 5.
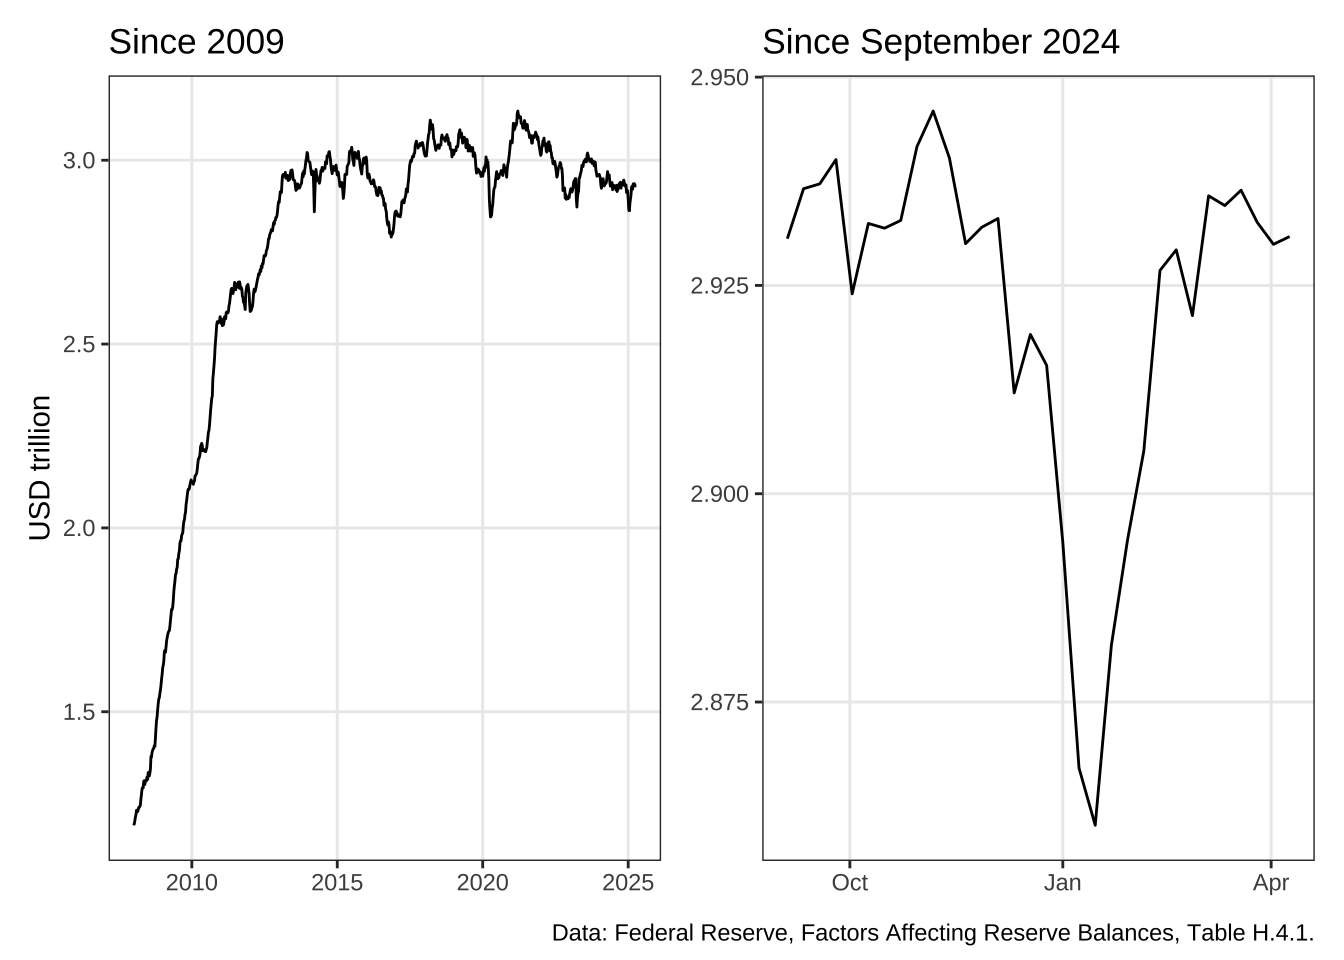
Note that this data includes “inflation compensation on Treasury Inflation-Protected Securities (TIPS), which captures the inflation adjustment to original face value of TIPS over time.” I’m assuming that this is a relatively small part of foreign official holdings at the Fed. In any case, that’s the reason I’m showing this in nominal rather than in constant dollars. In constant dollars, there has been a steep downward trend over the past decade.
References
Aldasoro, Iñaki, and Sebastian Doerr. 2025. Money Market Funds and Sponsored Repo: An Update. Rochester, NY. https://papers.ssrn.com/abstract=5188246.
Citation
BibTeX citation:
@online{braun2026,
  author = {Braun, Benjamin},
  title = {Who Holds {U.S.} {Treasuries?}},
  date = {2026-01-19},
  url = {https://www.benjaminbraun.org/posts/treasury-holdings/},
  langid = {en}
}
For attribution, please cite this work as:
Braun, Benjamin. 2026. “Who Holds U.S. Treasuries?” January
19. https://www.benjaminbraun.org/posts/treasury-holdings/.