What are distributional wealth accounts?
Data allowing for comparative analysis of household wealth portfolios across space and time has been scarce. The best survey-based source has been the Luxembourg Wealth Study (Pfeffer and Waitkus 2021). However, lacking consistency with national accounting frameworks, survey-based wealth data remains unsatisfying from a macroeconomic perspective.
Therefore, those of us who spend too much time in the financial accounts have eagerly awaited the advent of distributional financial accounts. The Fed has been publishing such accounts since 2019. The European System of Central Banks (ESCB) has been working to catch up and, at last, has just published what it calls “distributional wealth accounts.” The purpose of these DWA, as stated in the accompanying methodological note, “is to meet the growing interest in adding distributional information to macroeconomic sector accounts.”
Before, there were two statistical sources that contained information about the assets and liabilities of euro area households:
- Financial accounts, which are part of the ESCB’s Quarterly Sector Accounts. To get a sense of what this aggregate sectoral balance sheet data tells us about household wealth, check out the ECB’s financial accounts dashboard.
- The Household Finance and Consumption Survey (HFCS), which periodically collects data on the distribution of wealth among households in all euro area countries.
The DWA combines these two data sources. The goal is to provide data on the distribution of household wealth that adds up to (i.e., is consistent with) the aggregates found in the financial accounts.
The usefulness of distributional data hinges on how users can slice and dice it. The DWA offer three breakdowns: by net wealth grouping, by home-owner status, and by working status. For each breakdown, three measures are available: total amounts, means per household, and means per capita.
As this post will show, we can learn a lot from this data. There is, however, a big disappointment: The data does not allow for granular breakdowns at the top of the wealth distribution. The top wealth group is the top decile, or the richest 10 per cent of households, meaning we can learn next to nothing about what is going on at the very top. Compare this to the US, where the Fed’s much more granular data show that the asset portfolios of the top 1 per cent—and even more so of the top 0.1 per cent—differ dramatically from those of the next 9 per cent.
This is all the more disappointing since at least some national central banks do, in fact, have the data to further break down the top decile. See, for instance, the July 2022 Monthly Report of the Bundesbank. Researchers should push the ESCB on this point. After all, when it comes to wealth, the action is not in the top decile, but in the top percentile.
This complaint notwithstanding, exploring the DWA is still a highly worthwhile exercise for students of wealth and wealth inequality. Let’s dive in.
Top-5% share of total wealth
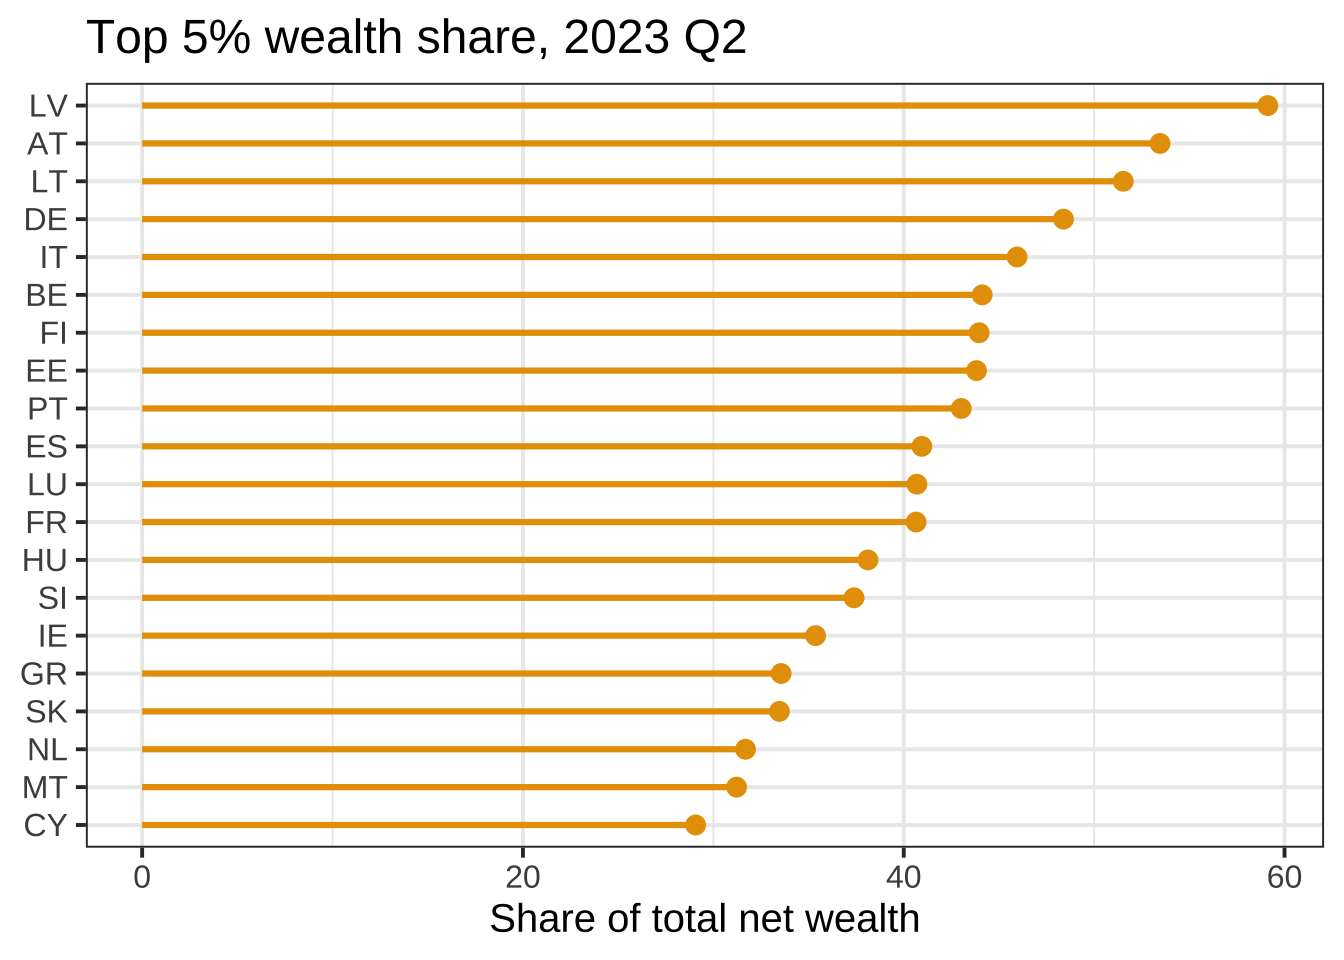
The first thing you want to know of distributional wealth accounts is how much wealth is concentrated at the top. For total net wealth, the DWA offer a slightly better top-end breakdown than for other measures: the top 5%.
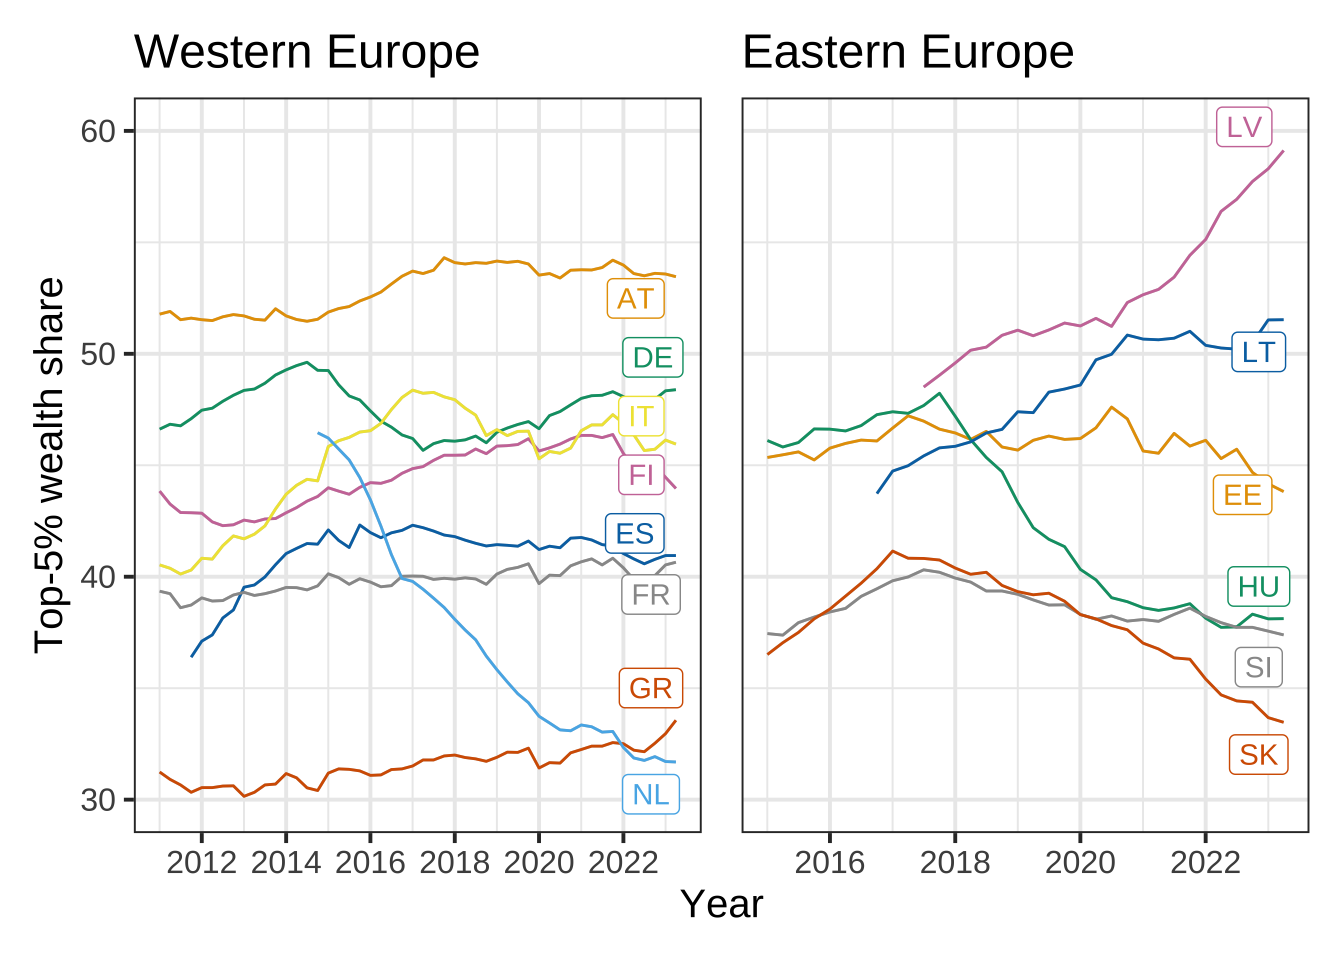
The first panel below shows the top 5% share in total net wealth for the latest available period, 2023 Q2. At the top we find Latvia, Austria, Lithuania, and Germany, where the richest 5% of households own between 59 and 48 per cent of total net wealth.
Panels two and three show the top-5% share over time, for (selected) Western European and all Eastern European countries in the euro area. With the exception of the Netherlands, where something potentially funny seems to be going on, the concentration of wealth at the top has increased in Western Europe since 2011. In Eastern Europe, where time series are a bit shorter, only Latvia and Lithuania show a clear upward trend.
Wealth portfolios across the wealth distribution
Different asset classes have different rates of return. Economic historians have shown that, over the long run, higher-risk assets—notably equities—yield higher returns than low-risk assets such as life insurance or bonds. Housing, too, has performed exceptionally well (Jordà et al. 2019).
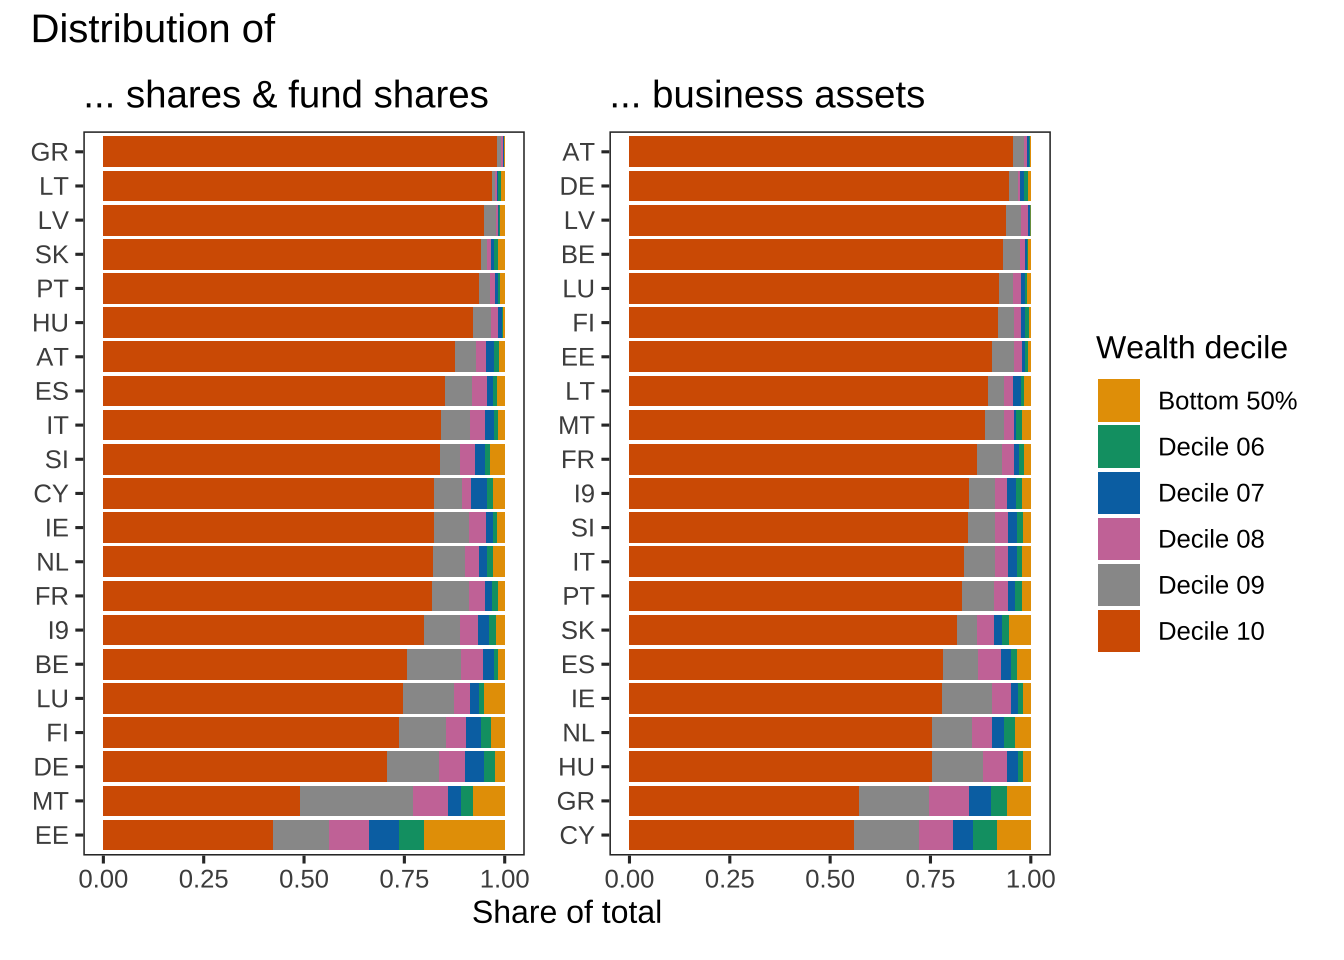
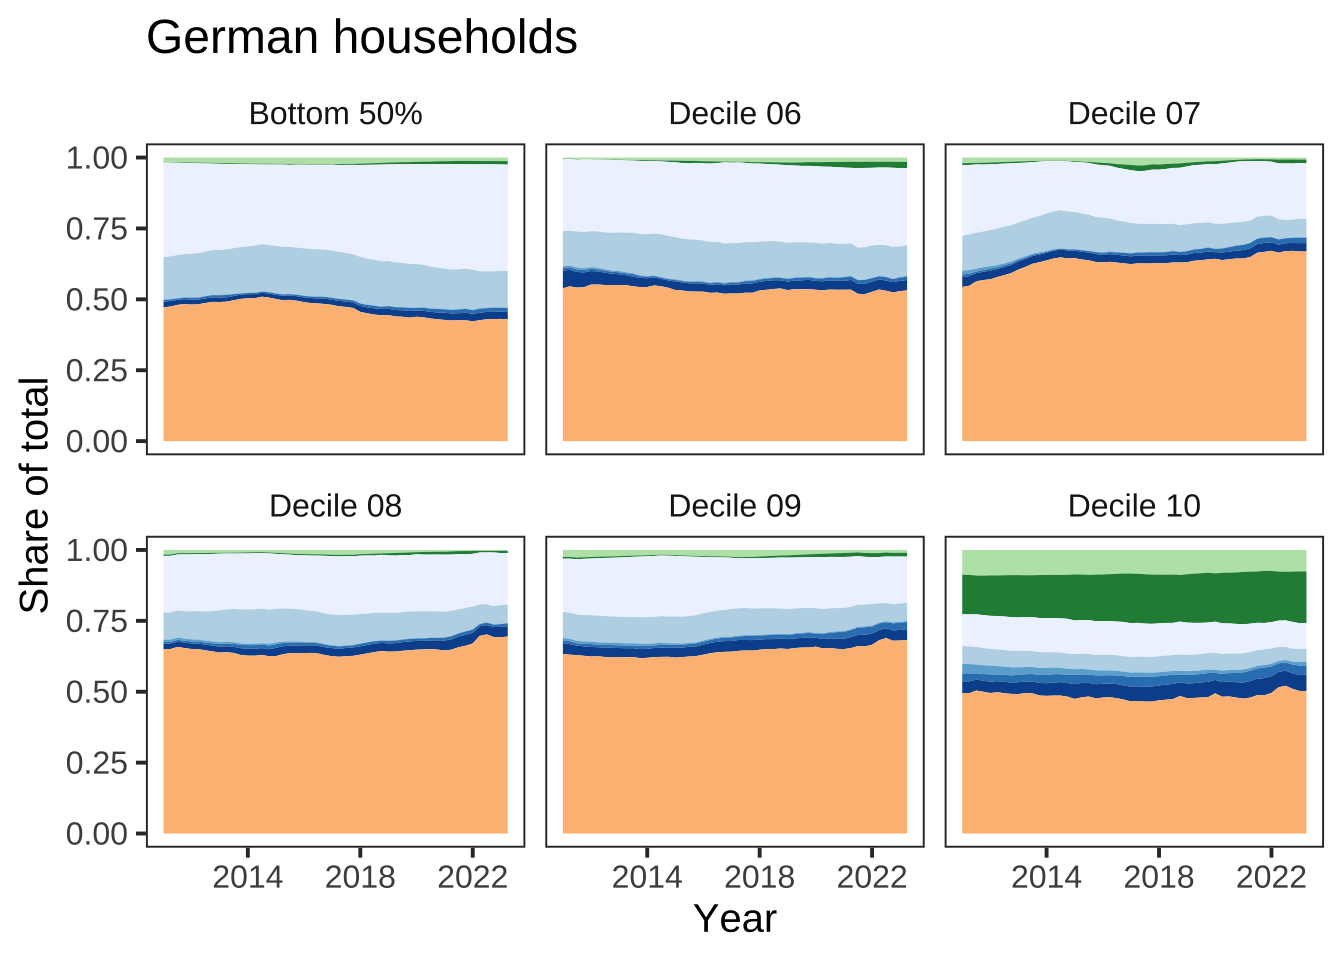
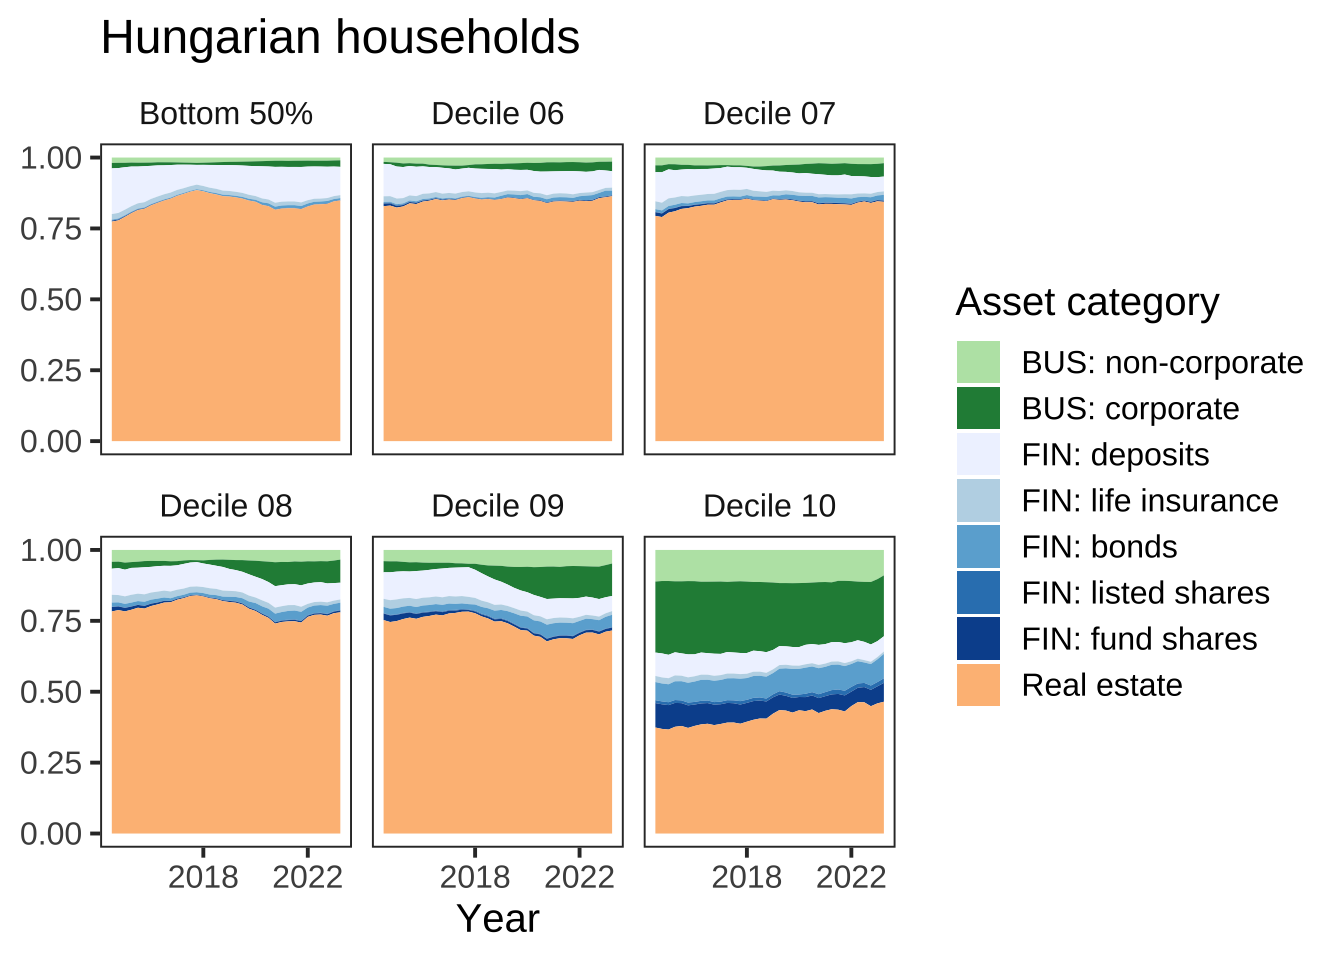
Here is where the DWA are particularly useful, since they allow us to study the composition of household portfolios across the wealth distribution (as well as by employment status and by housing status). Displayed below is the breakdown by wealth deciles for Germany and Hungary. Green areas are business assets (“BUS”), blue are financial assets (“FIN”).
Across all wealth deciles and countries, real estate is the dominant asset in household portfolios. However, in a society with a comparatively low home ownership rate such as Germany, real estate accounts for a much smaller share of household wealth in the lower wealth deciles. This difference disappears in the top wealth decile, where business and financial wealth become much more important, accounting for about half of the wealth of the richest 10%.
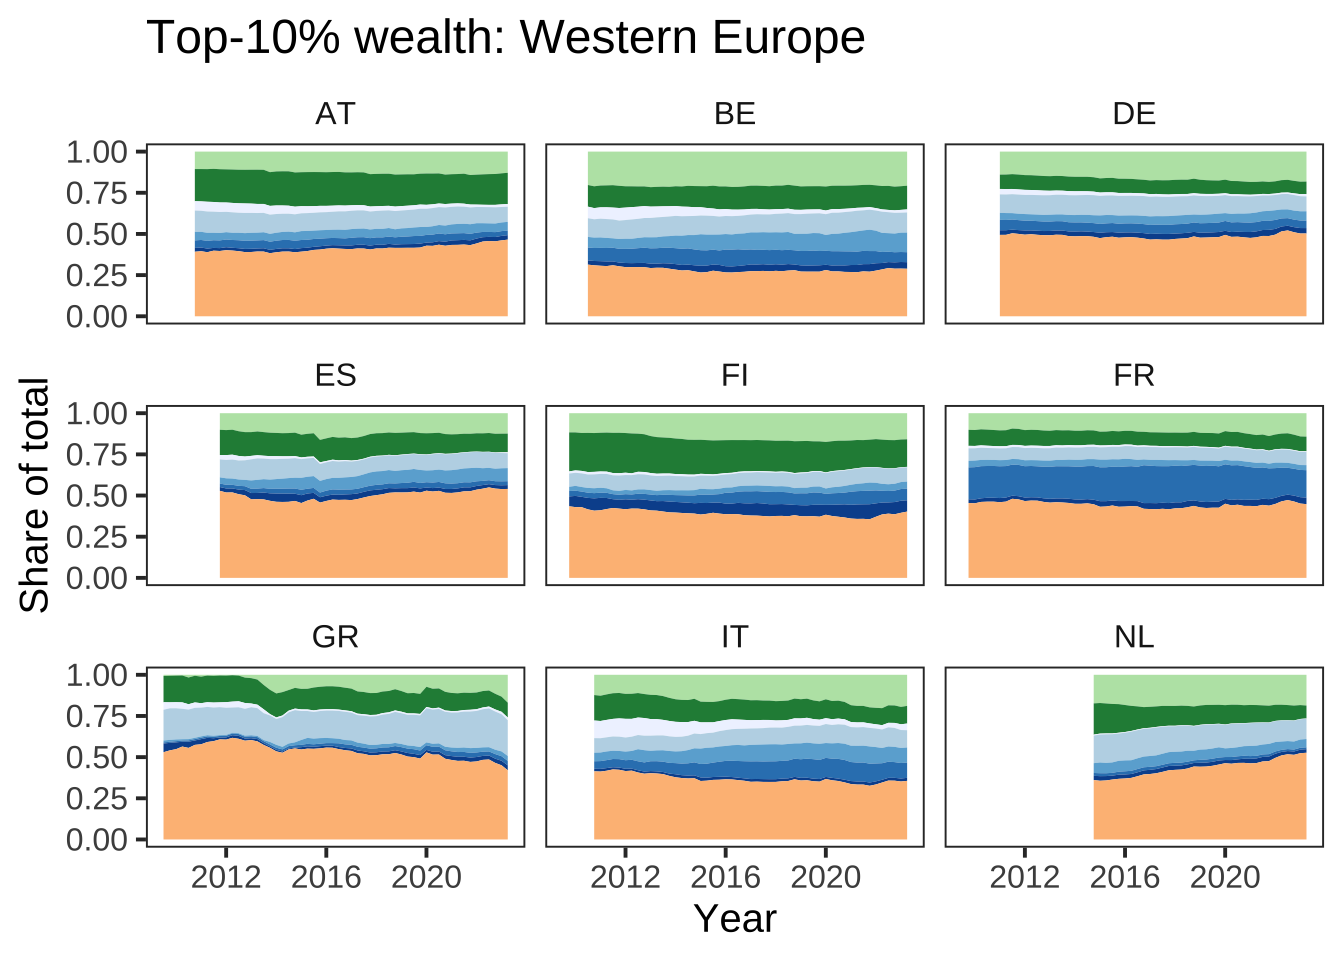
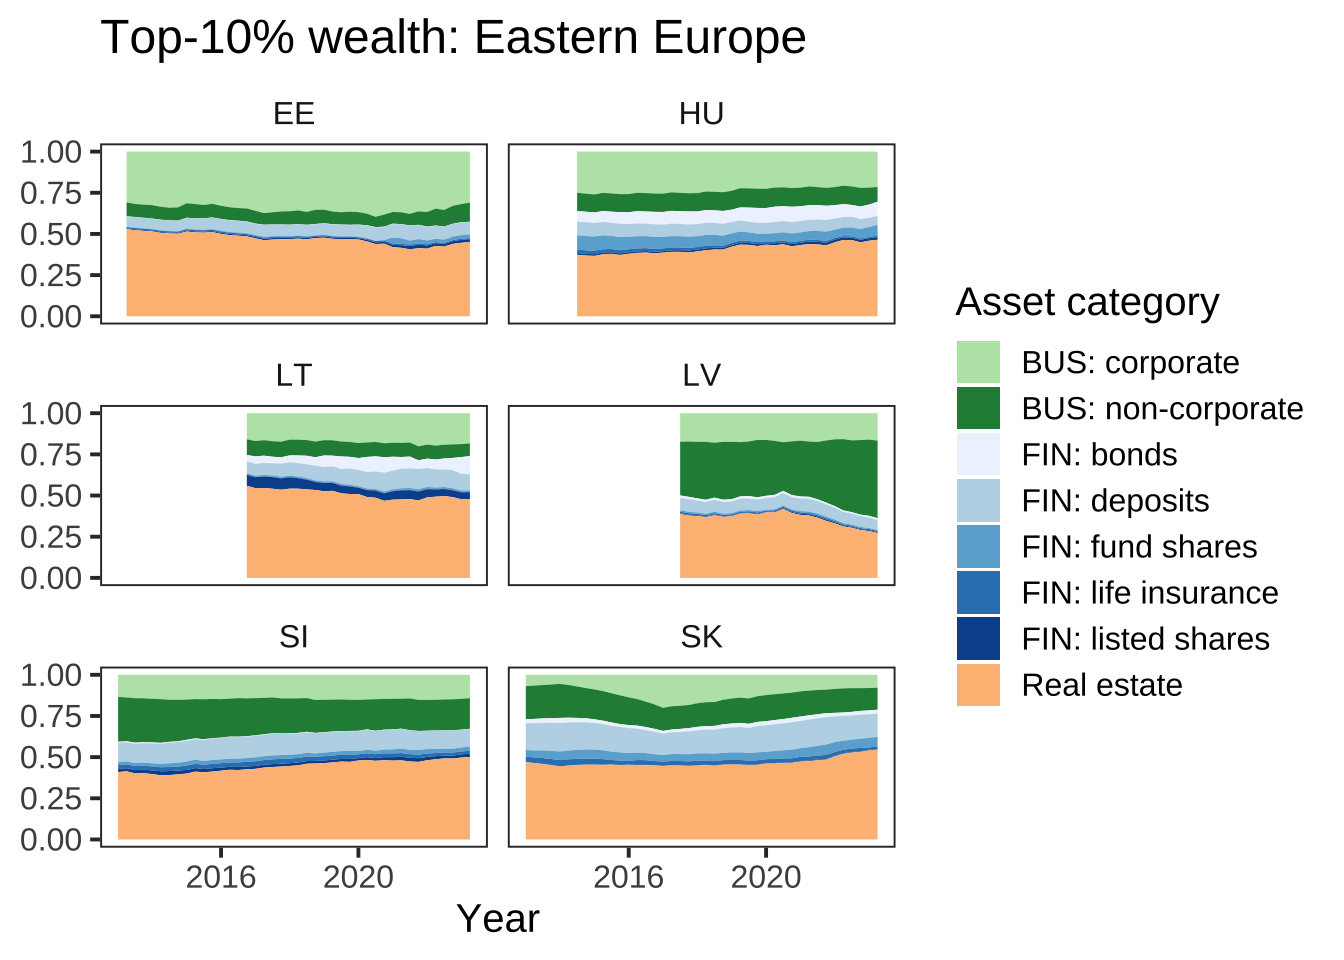
Top 10% wealth composition by country
How does the composition of top-end wealth portfolios vary across countries, and how has it evolved over time within countries? Even though the DWA do not allow us to look into the portfolio composition of the top 1%, doing so for top 10% is still instructive.
Within countries, the composition is relatively stable over time. In most countries, real estate makes up one half of the wealth of the top decile, while the other half is split roughly equally between business assets and financial assets. One country displaying a significant change in top-decile wealth composition is the Netherlands, where the real estate share has markedly increased in recent years (this is likely primarily a valuation effect, driven by Dutch house prices appreciating faster than other asset classes).
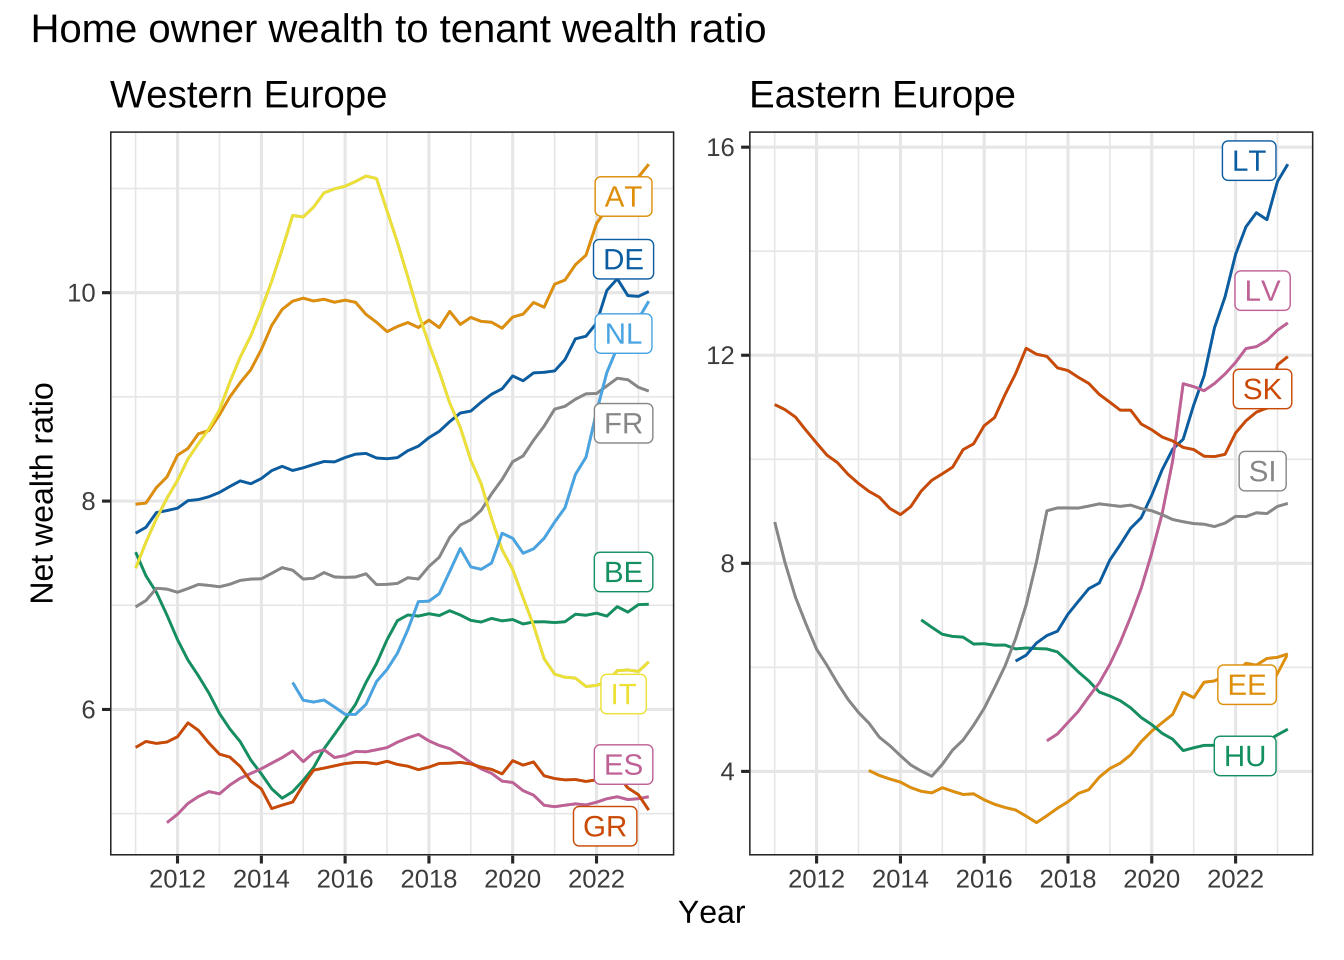
Home owners versus tenants
As mentioned, the DWA allow two more breakdowns besides wealth groupings: by housing status (home owner - tenant) and by employment status (employed - self-employed - unemployed). Given the centrality of real estate in household wealth, we should expect home owners to be considerably richer than non-home owners. But how much richer exactly?
The answer is somewhat shocking—the average home-owning household is about 5 to 12 times richer than the average tenant household. In the extreme case of Lithuania, the ratio is 16 times. With the exceptions of countries that have seen a sluggish recovery of house prices from post-2008 lows (Greece, Spain) or where house price growth has essentially been flat (Italy), the wealth gap between home owners and tenants has increased enormously across the board, in both Eastern and Western European countries. In other words, extreme wealth divergence based on home ownership, recently impressively documented by John Burn-Murdoch in the Financial Times, is by no means unfamiliar to euro area countries.
Conclusion
In this post, I’ve shown some interesting ways in which the DWA can be sliced and diced. Many more combinations of wealth groupings and asset category are possible. You can access the DWA via ECB’s data portal here, or download the entire dataset as a csv file here. As wealth and inequality researchers we should push the ECB and the national central banks to do better and provide a breakdown that includes—as is the case in the Fed’s distributional financial accounts—a breakdown for the top 1% and even for the top 0.1%.
References
Jordà, Òscar, Katharina Knoll, Dmitry Kuvshinov, Moritz Schularick, and Alan M. Taylor. 2019. “The Rate of Return on Everything, 18702015.” Quarterly Journal of Economics 134 (3): 12251298.
Pfeffer, Fabian T., and Nora Waitkus. 2021. “The Wealth Inequality of Nations.” American Sociological Review 86 (4): 567–602. https://doi.org/10.1177/00031224211027800.
Citation
BibTeX citation:
@online{braun2024,
  author = {Braun, Benjamin},
  title = {Exploring the {ECB’s} Distributional Wealth Accounts},
  date = {2024-01-16},
  url = {https://www.benjaminbraun.org/posts/dwa/},
  langid = {en}
}
For attribution, please cite this work as:
Braun, Benjamin. 2024. “Exploring the ECB’s Distributional Wealth
Accounts .” January 16. https://www.benjaminbraun.org/posts/dwa/.